The Complete Snow Forecast Guide: How to Read Winter Weather Predictions Like a Meteorologist
Weather apps show you snow totals. Meteorologists read probability distributions, model ensembles, and QPF charts. Here is how to understand winter storm forecasts the way the professionals do.
If you have ever wondered why weather forecasts sometimes show "3–7 inches of snow" with such a wide range, or why two different apps show completely different snowfall totals for your town, you are not alone. Winter storm forecasting is genuinely one of the most technically challenging tasks in modern meteorology. This guide explains how professional meteorologists build winter storm forecasts — and how you can use that knowledge to make your own better predictions.
The Fundamental Challenge: Snowfall Banding
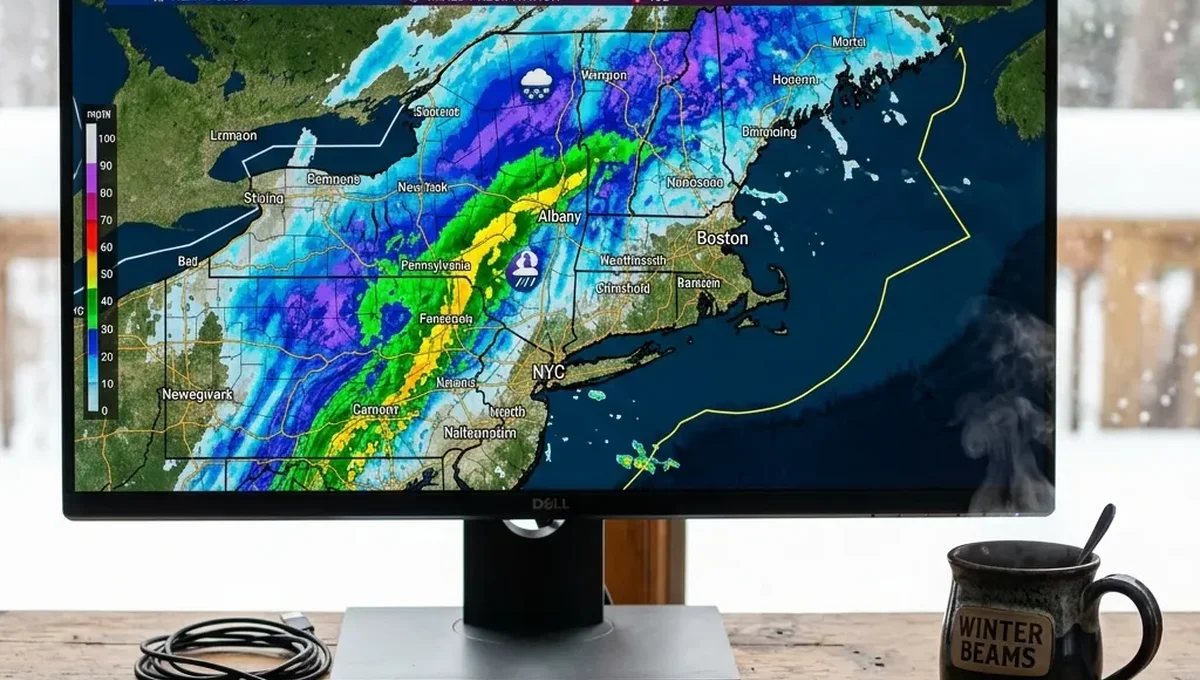
The single biggest source of error in winter storm forecasts is a phenomenon called snowfall banding. During nor'easters, Alberta Clippers, and other organized winter systems, snowfall does not fall evenly across a region. Instead, it concentrates in narrow, intense bands — often only 20–50 miles wide — where snowfall rates can exceed 2–3 inches per hour, while areas just 30 miles to either side receive only flurries.
These bands are controlled by atmospheric dynamics that operate at a scale too small for most forecast models to capture precisely. The band may be forecast correctly in terms of its general location, but shift north or south by 40 miles from where models predicted — meaning the heaviest snow misses your city entirely, or hits you instead of your neighbor 40 miles away.
When a forecast says "3–7 inches," meteorologists are not being vague — they are telling you that the difference between 3 and 7 inches depends on the precise track of a storm system that has genuine model uncertainty. The honest answer is sometimes "we don't know exactly."
Understanding the Key Forecast Models
GFS (Global Forecast System)
The GFS is the primary American numerical weather prediction model, run by NOAA four times daily at 0Z, 6Z, 12Z, and 18Z (UTC). It covers the entire globe at a horizontal resolution of about 13 km and produces forecasts out to 16 days. For winter storm prediction, the GFS is most reliable within a 3–5 day window. Beyond that, it is useful for identifying general storm tracks but should not be used for specific snowfall totals.
ECMWF (European Model)
The European Centre for Medium-Range Weather Forecasts (ECMWF) model, commonly called "the Euro," is widely regarded as the world's most accurate global forecast model. It correctly predicted the track of Hurricane Sandy 7 days in advance when the GFS was still showing the storm moving out to sea. For winter storms, meteorologists typically give the Euro higher weight than the GFS when the two models disagree.
NAM (North American Mesoscale)
The NAM is a higher-resolution regional model that covers North America at approximately 3–12 km resolution. It is more useful than GFS or ECMWF for forecasting local terrain effects — like the Lake Effect snow belts of the Great Lakes — but less reliable beyond 60 hours.
The Critical 12-Hour Forecast Window
For snow day prediction purposes, the most important forecast window is the 12-hour period centered on school bus departure time — roughly 8 PM the evening before to 8 AM the morning of the storm. During this window, forecast model accuracy improves dramatically as the storm system comes within shorter range of weather observation networks.
The 8 PM evening update is the critical check-in. At this point, the storm is close enough that model uncertainty narrows significantly, and the NWS often updates Winter Storm Watches to Warnings (indicating 90%+ confidence). If a Winter Storm Warning is posted for your county at the 8 PM update, the probability of school closure the next morning jumps dramatically — typically to 75%+ regardless of region.
NWS Winter Weather Alert Hierarchy
Understanding what each NWS alert means is crucial for interpreting snow day probability:
Less than warning criteria but still hazardous. Snow, freezing drizzle, or sleet. School delay probability: 40–60%.
Warning criteria possible within 48 hours. Decision-makers begin monitoring. School closure probability: 50–70%.
Hazardous conditions expected within 36 hours. High confidence. School closure probability: 80–95%.
Sustained winds over 35 mph with blowing snow reducing visibility to under 1/4 mile. School closure probability: 97–99%.
Significant ice accumulation expected (0.25+ inches). The highest single closure trigger. School closure probability: 98–99%.
How to Track a Winter Storm in Real Time
Here is a professional workflow for tracking a winter storm from 5 days out to the morning of:
- 5–7 days out: Check for a storm system on GFS and Euro ensembles. High uncertainty — look for general track agreement between models, not snow totals.
- 3–4 days out: Model agreement improves. Check if NWS has issued a Winter Storm Watch for your county. This is the first meaningful signal.
- 24–48 hours out: NAM model becomes useful. Check hourly snowfall rate forecasts — rate matters as much as total accumulation for road conditions.
- 12–18 hours out: Use our snow day calculator for the most accurate prediction using live forecast data. Check if a Winter Storm Warning has been issued.
- 8 PM the night before: Final check. Run our predictor for the latest probability. Watch for school district announcements on social media.
Apply What You've Learned ❄️
Run our forecast-based snow day calculator to see a professional-grade prediction for your area, updated every 15 minutes from live NWS data.
Check My Snow Day Odds